Heketi Integrated Metrics with Prometheus and Grafana in OCP 3.11
Since I started using OCP with GlusterFS one of the bigger blocker was the lack of metrics for GlusterFS. Now we have GlusterFS 3.4.0 with heketi 7 which ships the integrated metrics endpoint for Prometheus. Searching in our documentation, I found Architects – Red Hat Storage but it doesn’t work for OCP 3.11 because the entire Prometheus framework has changed. I found https://bugzilla.redhat.com/show_bug.cgi?id=1644665 which brought me to an internal Redhat document and from here I started ordering all the pieces of the puzzle.
In my lab I installed OCP 3.11.43 with RHGS 3.4.0 with 2 separate GlusterFS
- glusterfs
to provision PVC for the apps
- glusterfs_registry
to provision PVC for the infrastructure components
[glusterfs]
ocp-node-gluster1.example.com glusterfs_devices='[ "/dev/sdc", "/dev/sdd" ]'
ocp-node-gluster2.example.com glusterfs_devices='[ "/dev/sdc", "/dev/sdd" ]'
ocp-node-gluster3.example.com glusterfs_devices='[ "/dev/sdc", "/dev/sdd" ]'
[glusterfs_registry]
ocp-node-gluster4.example.com glusterfs_devices='[ "/dev/sdc", "/dev/sdd" ]'
ocp-node-gluster5.example.com glusterfs_devices='[ "/dev/sdc", "/dev/sdd" ]'
ocp-node-gluster6.example.com glusterfs_devices='[ "/dev/sdc", "/dev/sdd" ]'
I checked the Heketi metrics endpoint
[root@ocp-master1 ~]# oc get svc -n ocs-infra
NAME TYPE CLUSTER-IP EXTERNAL-IP PORT(S) AGE
heketi-db-registry-endpoints ClusterIP 172.30.34.253 <none> 1/TCP 10h
heketi-registry ClusterIP 172.30.17.135 <none> 8080/TCP 10h
[root@ocp-master1 ~]# curl 172.30.17.135:8080/metrics -s | head -n1
# HELP go_gc_duration_seconds A summary of the GC invocation durations.
[root@ocp-master1 ~]# oc get svc -n ocs-app
NAME TYPE CLUSTER-IP EXTERNAL-IP PORT(S) AGE
heketi-db-storage-endpoints ClusterIP 172.30.227.21 <none> 1/TCP 10h
heketi-storage ClusterIP 172.30.138.116 <none> 8080/TCP 10h
[root@ocp-master1 ~]# curl 172.30.138.116:8080/metrics -s | head -n1
# HELP go_gc_duration_seconds A summary of the GC invocation durations.
[root@ocp-master1 ~]#
Prometheus uses servicemonitors, new resources introduced by the Prometheus Operator which describe the set of targets to be monitored in OCP 3.11 (more information about Prometheus Operator here), so I had to create those objects:
[root@ocp-master1 ~]# cat heketi-infra-sm.yaml
apiVersion: monitoring.coreos.com/v1
kind: ServiceMonitor
metadata:
name: heketi-infra
labels: k8s-app: heketi-infra
namespace: openshift-monitoring
spec:
endpoints:
- bearerTokenFile: /var/run/secrets/kubernetes.io/serviceaccount/token
interval: 30s
port: heketi
scheme: http
targetPort: 0
namespaceSelector:
matchNames:
- ocs-infra
selector:
matchLabels:
heketi: registry-service
[root@ocp-master1 ~]# oc create -f heketi-infra-sm.yaml -n openshift-monitoring
servicemonitor.monitoring.coreos.com/heketi-infra created
[root@ocp-master1 ~]#
[root@ocp-master1 ~]# cat heketi-app-sm.yaml
apiVersion: monitoring.coreos.com/v1
kind: ServiceMonitor
metadata:
name: heketi-app
labels: k8s-app: heketi-app
namespace: openshift-monitoring
spec:
endpoints:
- bearerTokenFile: /var/run/secrets/kubernetes.io/serviceaccount/token
interval: 30s
port: heketi
scheme: http
targetPort: 0
namespaceSelector:
matchNames:
- ocs-app
selector:
matchLabels:
heketi: storage-service
[root@ocp-master1 ~]# oc create -f heketi-app-sm.yaml -n openshift-monitoring
servicemonitor.monitoring.coreos.com/heketi-app created
[root@ocp-master1 ~]#
The two selectors at line had been found in the heketi svc:
[root@ocp-master1 ~]# oc project ocs-infra
Now using project "ocs-infra"
[root@ocp-master1 ~]# oc describe svc heketi-registry
Name: heketi-registry
Namespace: ocs-infra
Labels: glusterfs=heketi-registry-service
heketi=registry-service
...
[root@ocp-master1 ~]# oc project ocs-app
Now using project "ocs-app"
[root@ocp-master1 ~]# oc describe svc heketi-storage
Name: heketi-storage
Namespace: ocs-app
Labels: glusterfs=heketi-storage-service
heketi=storage-service
...
Final, add the cluster role to the prometheus-k8s service account:
[root@ocp-master1 ~]# oc adm policy add-cluster-role-to-user cluster-reader system:serviceaccount:openshift-monitoring:prometheus-k8s -n openshift-monitoring
cluster role "cluster-reader" added: "system:serviceaccount:openshift-monitoring:prometheus-k8s"
[root@ocp-master1 ~]#
After about 1 minute, Prometheus loaded the new servicemonitors: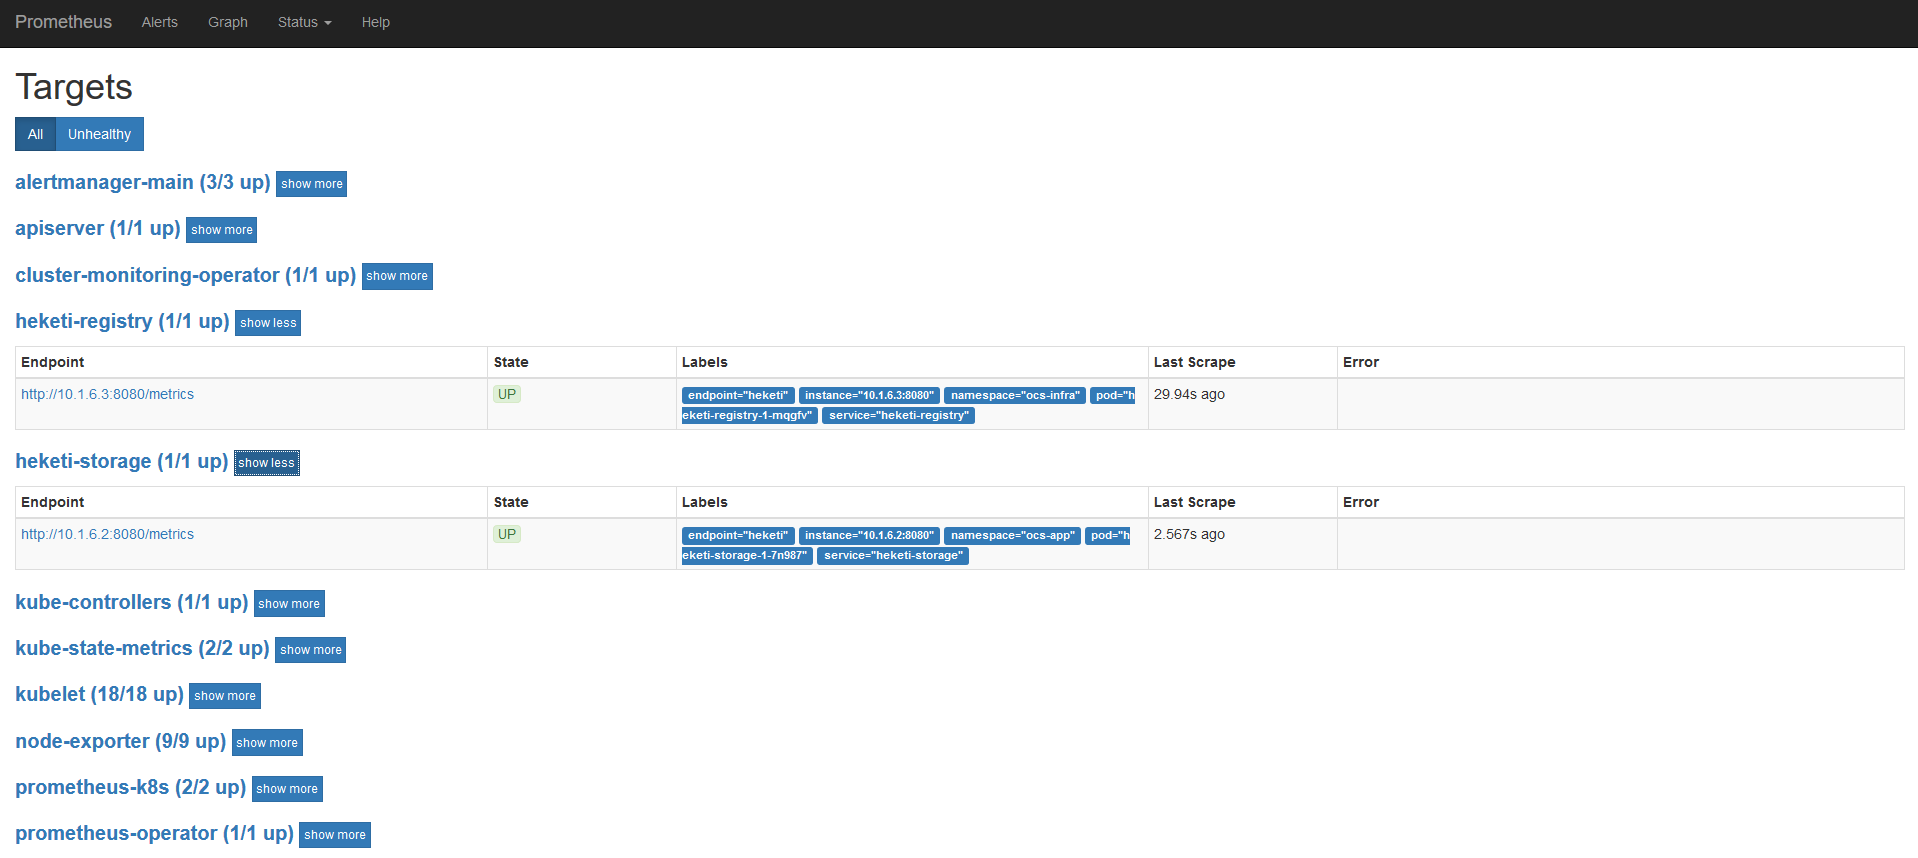
In the Grafana shipped with OCP 3.11, to have admin privileges you MUST have an user “admin” with cluster-admin cluster role. I created the user (htpasswd Identity Provider):
[root@ocp-master1 ~]# htpasswd /etc/origin/master/htpasswd admin
New password:Re-type new password:
Updating password for user admin
[root@ocp-master1 ~]#
And added it to the cluster role:
[root@ocp-master1 ~]# oc adm policy add-cluster-role-to-user cluster-admin admin
cluster role "cluster-admin" added: "admin"
[root@ocp-master1 ~]#
In the previous gdrive document you can find this mail http://post-office.corp.redhat.com/archives/sme-storage/2018-October/msg00388.html which contains a Grafana Dashboard for these metrics. I added some variables to manage more than 3 nodes and both GlusterFS clusters. Finally the new dashboard was imported: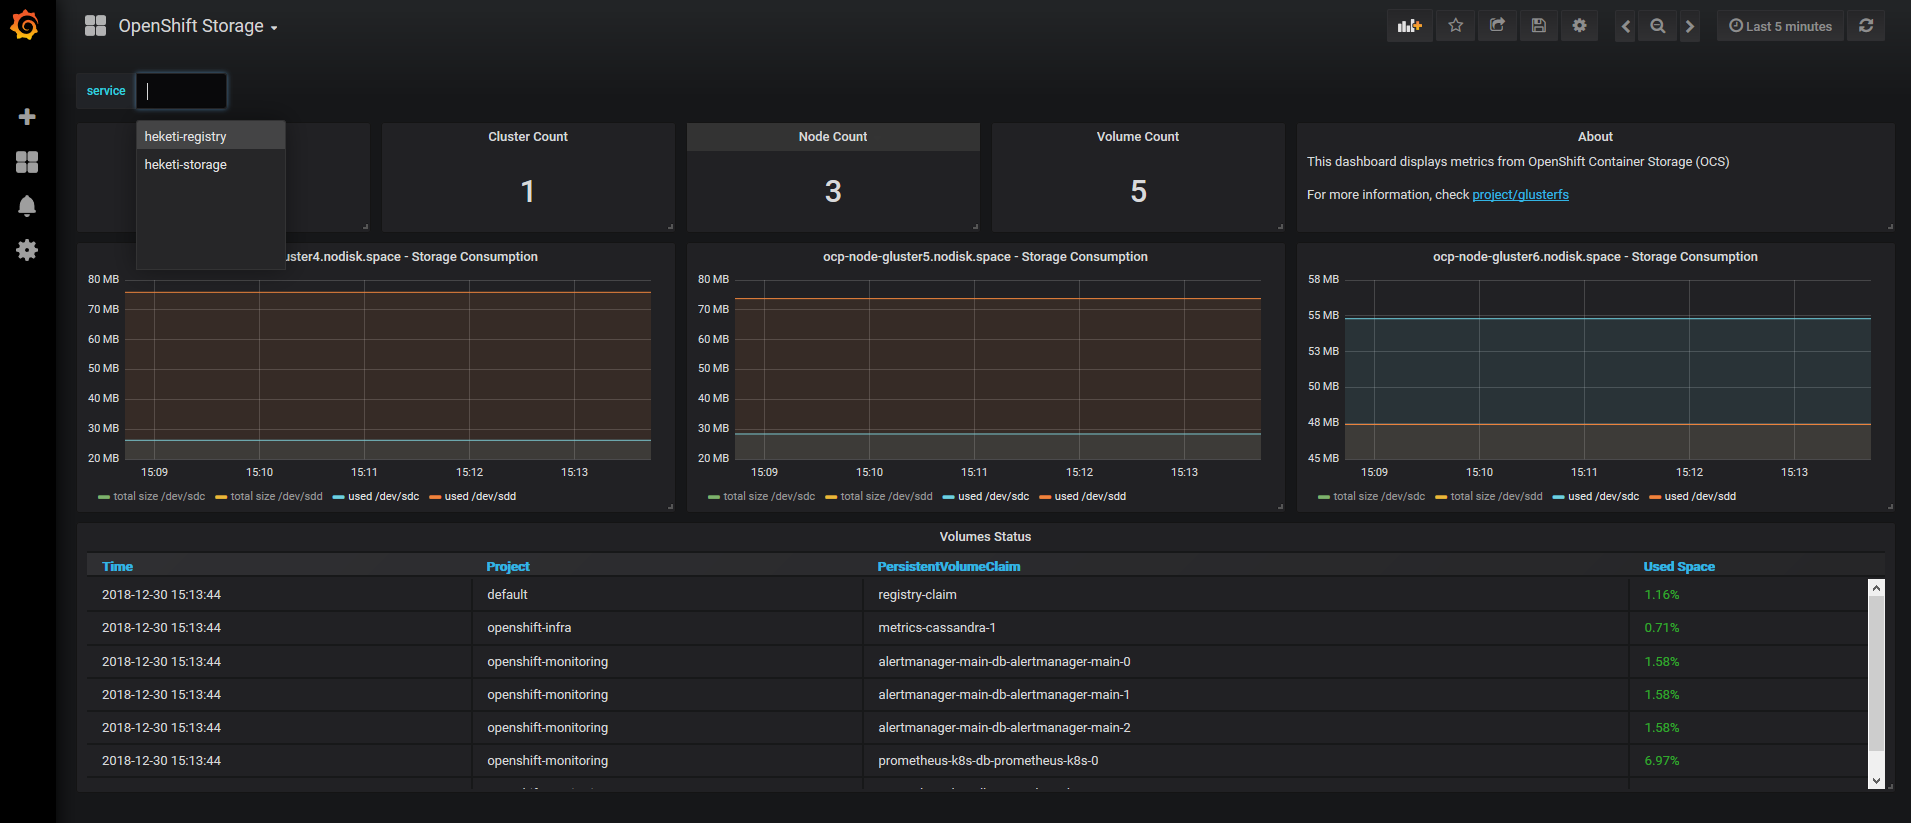
Please Note
Grafana uses ephemeral storage: if the pod is destroyed you MUST re-import this dashboard.
Enjoy your metrics!